About Me

I'm Maluhia, I love working on machine learning models as well as process analysis and improvement. Currently I am a founding member of the Solutions Engineering team at Paramark, a startup in San Francisco. There, I'm a full stack data professional, working in Python to do ETL on client marketing data, train and tune ML models, and design and analyze marketing budget experiments. I act as a relief team, taking analysis work off the software engineers' plates to let them work on the product that I use to analyze data! I have an MS in Analytics from Georgia Institute of Technology and a BS in Computer Science from BYU-Hawai'i.

Personal Projects

Take a look at what I've been working on

  • Sentimental Icon

    Breaking Grad(ients)

    Deep Learning, PyTorch, Object Oriented Programming, Neural Networks, Vision Transformers

    This Deep Learning project explores the effects of Fast Gradient Sign Method attacks on pre-trained models such as EfficientNet, Data Efficient Image Transformers, and our own custom JuanchitoCNN. We wanted to show how these models react to the common white-box attack of FGSM when discriminating between AI generated and naturally generated images.

    Read the Report

    GitHub & Code

  • Sentimental Icon

    Pokemon Team Personality Recommender

    Python, Natural Language Processing, APIs

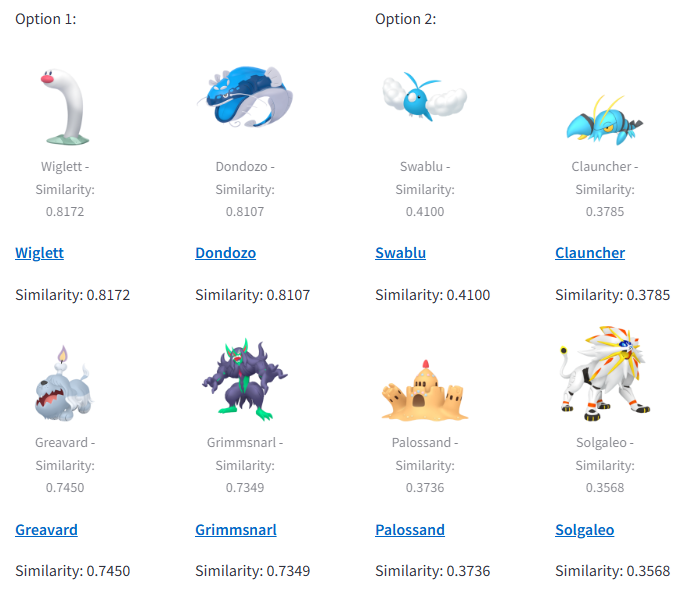
    This project takes personality inputs from a user, compares them to the Pokedex descriptions for each Pokemon, then returns a team based on cosine similarity. The project utilizes natural language processing techniques such as Bag of Words, Term Frequency Inverse Document Frequency, GloVe, and BERT.

    Check It Out

  • Sentimental Icon

    Sentimental

    R, R Shiny, Natural Language Processing

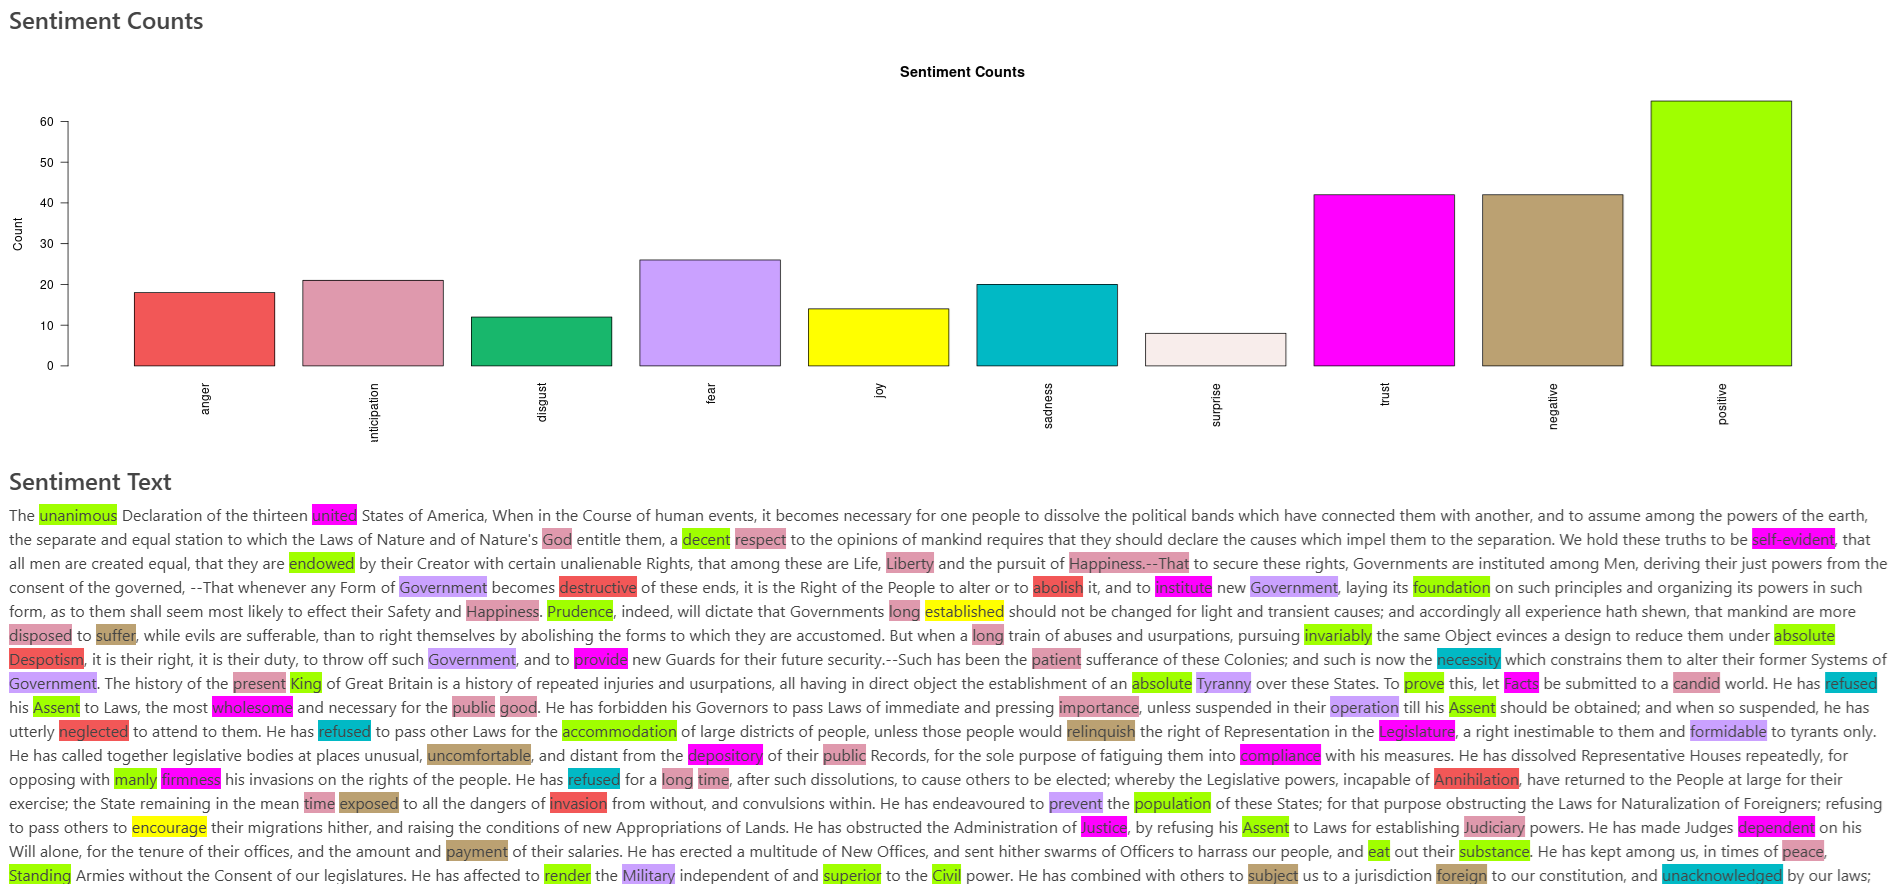
    This R Shiny tool is for blog writers and email marketers to see the sentiment and flow of their writing. The users get sentiment counts along with highlighted words associated with the count, a summary of what they wrote, ratio comparisons of sentiments, a list of ambiguous words to update to make their message more clear, and a writing trajectory which measures message valence by sentence. (The US Declaration of Independence is a great sample, takes about 21 seconds)

    Test It Out

  • Sentimental Icon

    Complainalyzer

    Python, R, Tableau, Time Series Analysis, Natural Language Processing

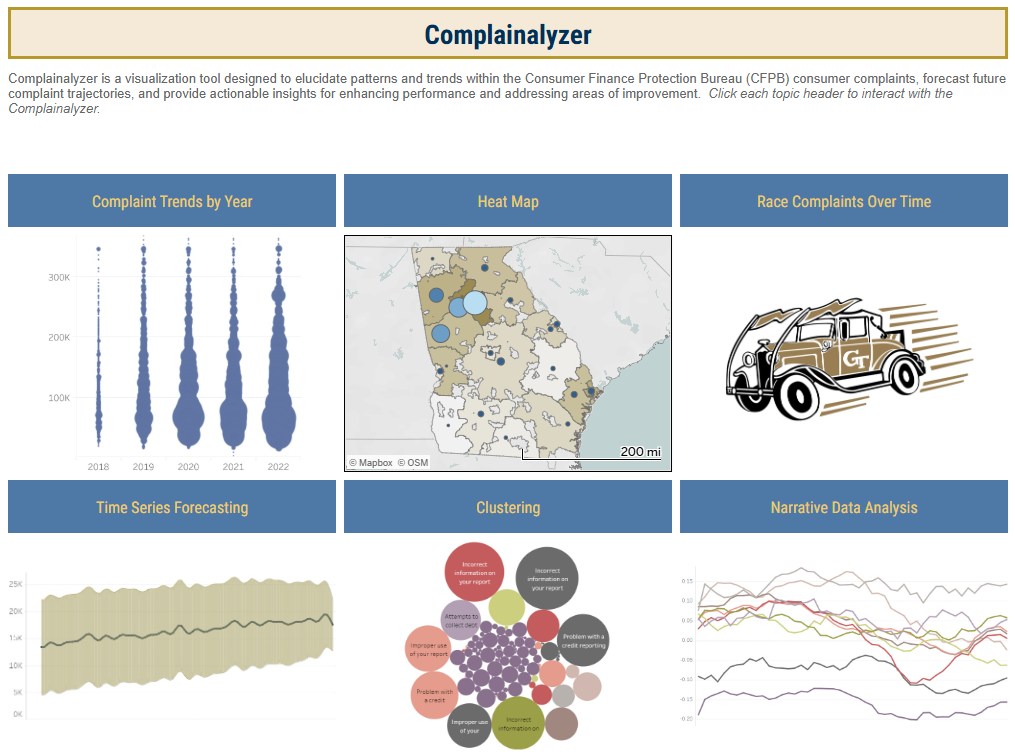
    Our goal was to transform the way consumer finance complaints from the Consumer Finance Protection Bureau (CFPB) database are visualized, understood, and addressed. We highlight patterns and trends in customer complaints using techniques such as LDA, VADER, and Bigram Analysis; and we continue to predict future complaint trajectories through Facebook Prophet and ARIMA.

    GitHub & Results

    Tableau Dashboard

  • Sentimental Icon

    Confusion Matrix Scaler

    R, R Shiny, Classification

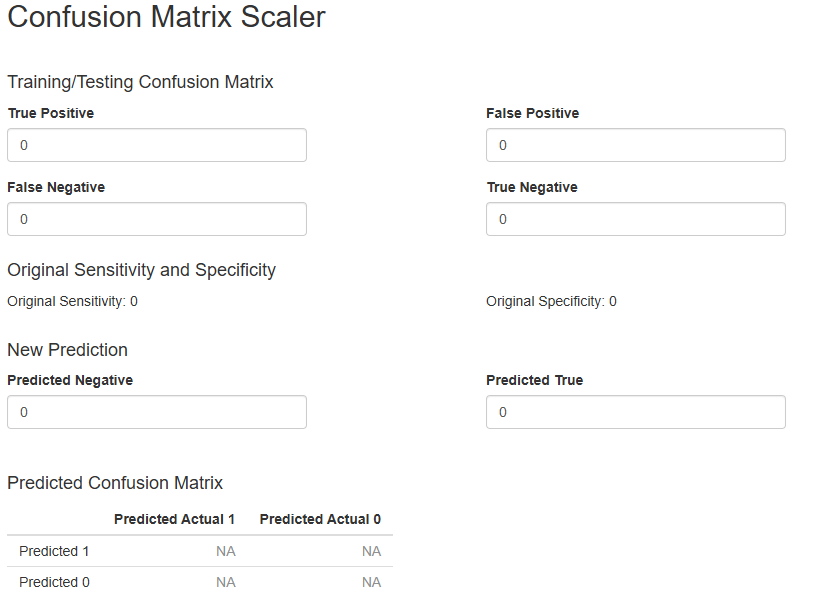
    This R Shiny tool is for scaling a confusion matrix up or down. I use the Scaler for compensating inaccuracies in a training/testing matrix against a new binary classification prediction. If my accuracy in training/testing is anything other than 100%, I want to be able to break down how many of the Predicted Positives and Predicted Negatives are likely to be False Positives and False Negatives. I use this on sales pipelines, after using classification methods to predict which deals will are likely to be closed won and which are likely to be closed lost.

    Try It

  • Sentimental Icon

    Pandemic Simulation

    Python, Statistical Analysis

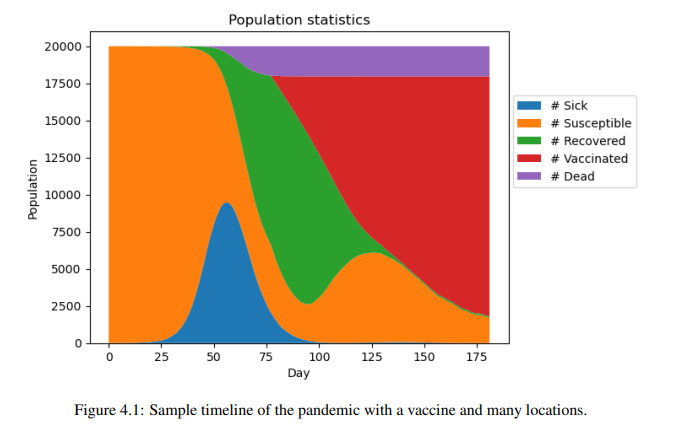
    This statistical analysis compares different pandemic scenarios and compares the severities of the situations. The project aimed to mimic real virus statistics, population density statistics, and vaccine distribution statistics.

    Read It

Work Projects

While my personal work is public, here is some of the more proprietary work I do:

Completed

  • Developed, validated, and deployed new time-series machine learning models, reducing average sales forecasting error from +16% to +1.5%
  • Identified waste in the sales forecasting process through data collection, ETL (Extract, Transform, Load) operations, exploration, and financial model prototyping, leading to a more scalable process and reducing time spent on forecasting tasks by 80%
  • Coordinated new Professional Services strategy among accounting, services, and sales operations teams, leading to a 50% reduction in time spent processing so far and a 90% reduction in by-hand errors
  • Developed and implemented A/B tests (DOE) for evaluating the performance of marketing assets, resulting in an increase of click-through rates from 5% to 13% on ads, and 15% to 22% on whitepapers
  • Formalized reporting, centralized data into HubSpot, and created redundancies for regular data quality checks leading to a sales pipeline increase of over 20%, as well as a 541% increase sales leads

Skills

  • Languages & Technology

    Python, PyTorch
    NumPy, Pandas
    Scikit-Learn, NLTK
    R, R Shiny
    SQL, SQLite
    Excel, VBA
    Tableau, Power BI
    Jupyter Notebooks

  • Data

    Time Series Analysis
    Neural Networks
    Exploratory Data Analysis
    Natural Language Processing
    Machine Learning
    Statistical Analysis
    Classification
    Clustering
    ETL Design

  • Business

    Sales Forecasting
    Process Improvement & Automation
    Project Management
    Customer Segmentation
    Churn Analysis
    Product Development & Analytics
    A/B Testing
    KPI Benchmarking
    Marketing Experimentation